# On demand coverage recording
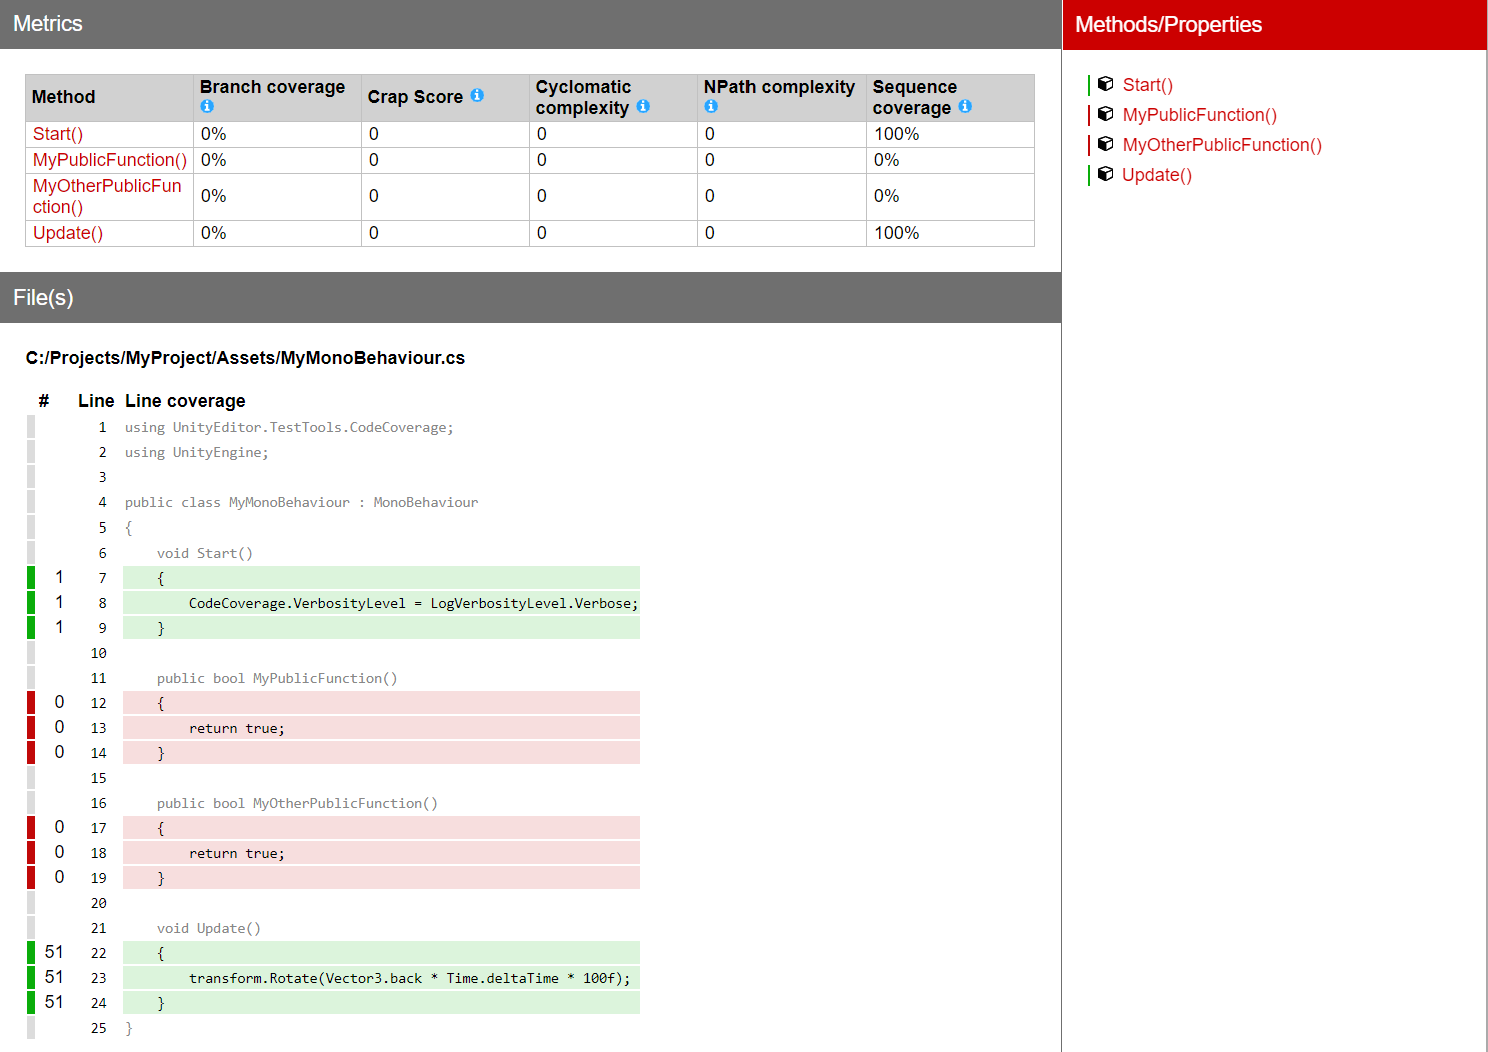
With Coverage Recording you can capture coverage data on demand and generate an HTML report which shows which lines of your code run while recording. It supports capturing in _EditMode_ as well as in _PlayMode_, and you can switch between the two.
To start recording coverage data, select the **Start Recording** button. While recording, use the editor as usual, for example to enter Play Mode. To stop recording coverage data, select the **Stop Recording** button. If **Auto Generate Report** is checked, then an [HTML report](HowToInterpretResults.md) is generated and a file viewer window opens. It contains the coverage results and the report. Otherwise, select the **Generate from Last** button to generate the report. The results are based on the assemblies specified in **Included Assemblies**.
You can also control Coverage Recording via the [CodeCoverage ScriptingAPI](https://docs.unity3d.com/Packages/com.unity.testtools.codecoverage@latest/index.html?subfolder=/api/UnityEditor.TestTools.CodeCoverage.CodeCoverage.html).
## Steps
1. Open the [Code Coverage window](CodeCoverageWindow.md) (go to **Window** > **Analysis** > **Code Coverage**).
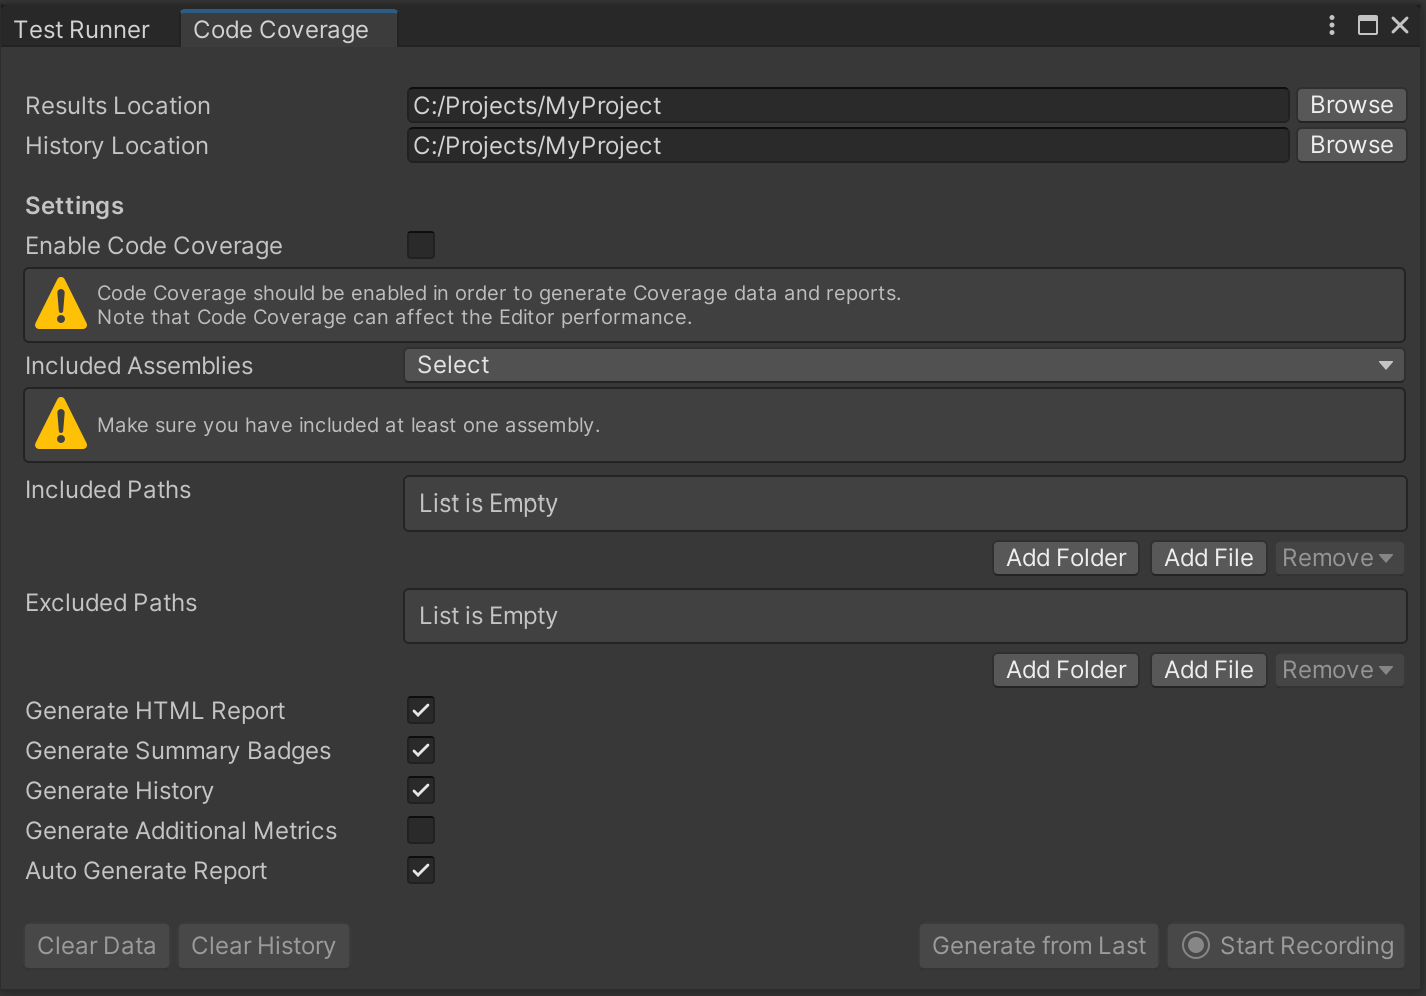
2. Select **Enable Code Coverage** if not already selected, to be able to generate Coverage data and reports.

**Note:** Enabling Code Coverage adds some overhead to the editor and can affect the performance.
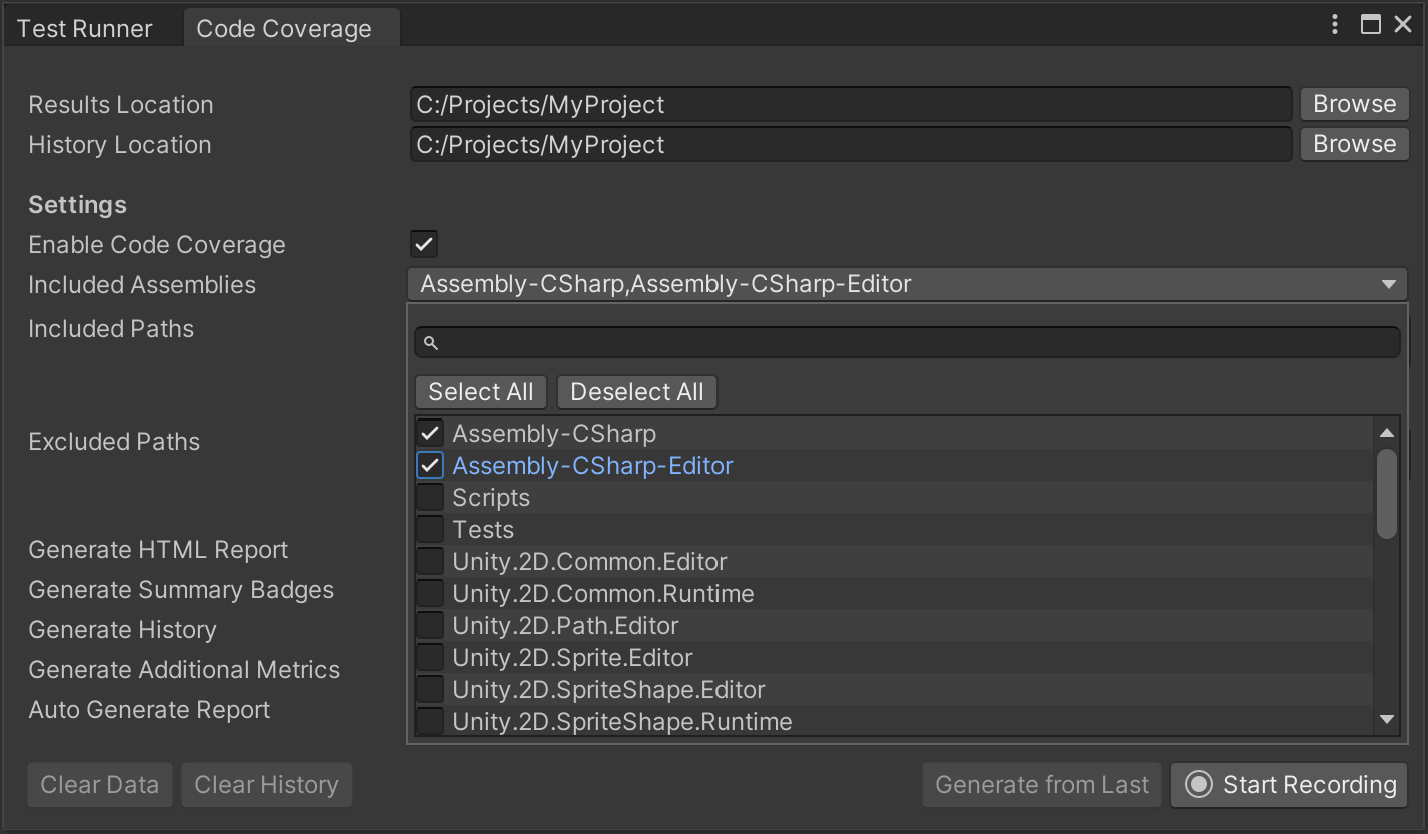
3. Select the [Assembly Definitions](https://docs.unity3d.com/Manual/ScriptCompilationAssemblyDefinitionFiles.html) you would like to see the coverage for. In this example we selected `Assembly-CSharp` and `Assembly-CSharp-Editor`. By default, Unity compiles almost all project scripts into the `Assembly-CSharp.dll` managed assembly and all editor scripts into the `Assembly-CSharp-Editor.dll` managed assembly.
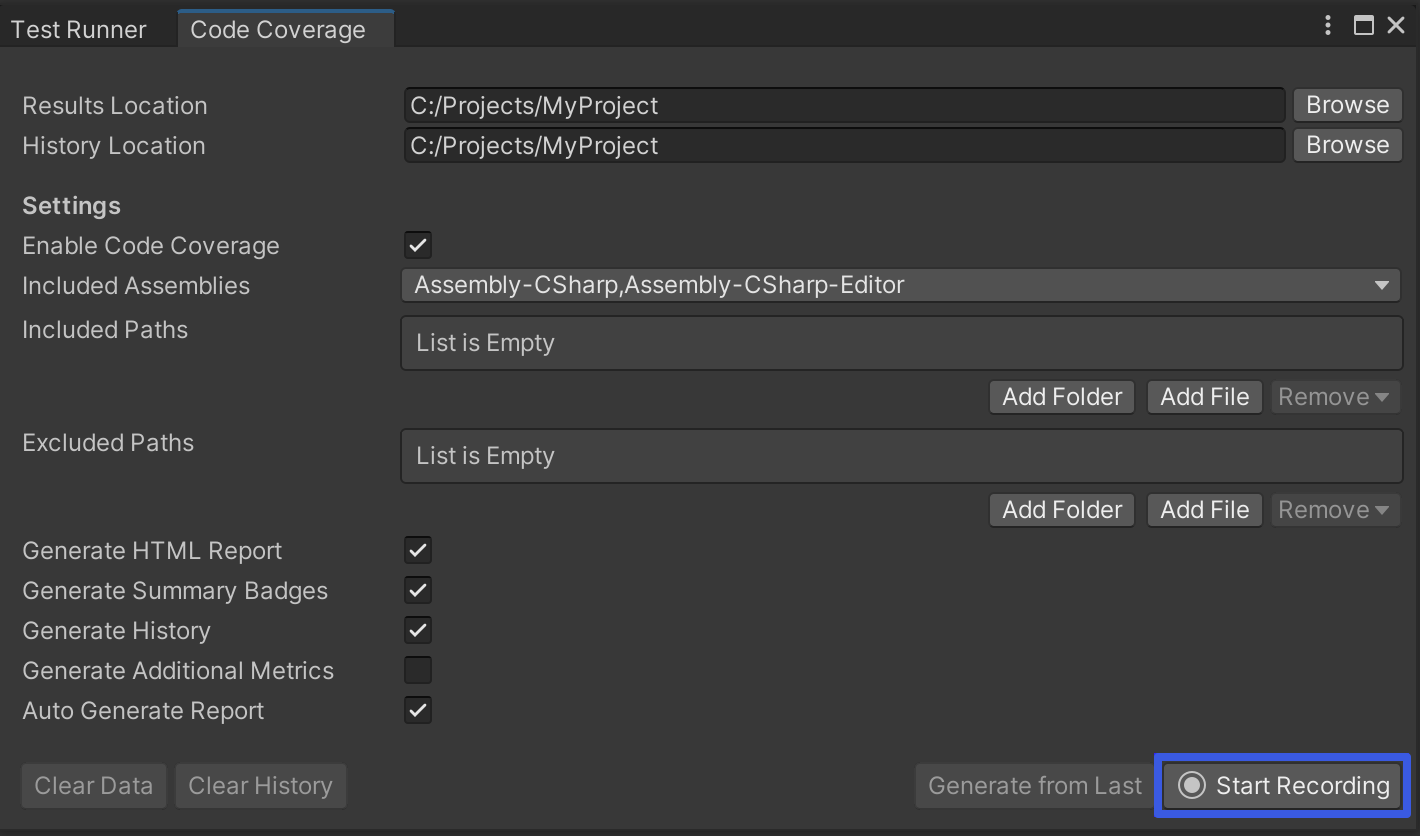
4. Select the **Start Recording** button.
5. Continue using the Editor as normal, for example enter _PlayMode_ to test your application or run some manual testing.
6. When you have finished your testing and have collected enough coverage data, select the **Stop Recording** button.
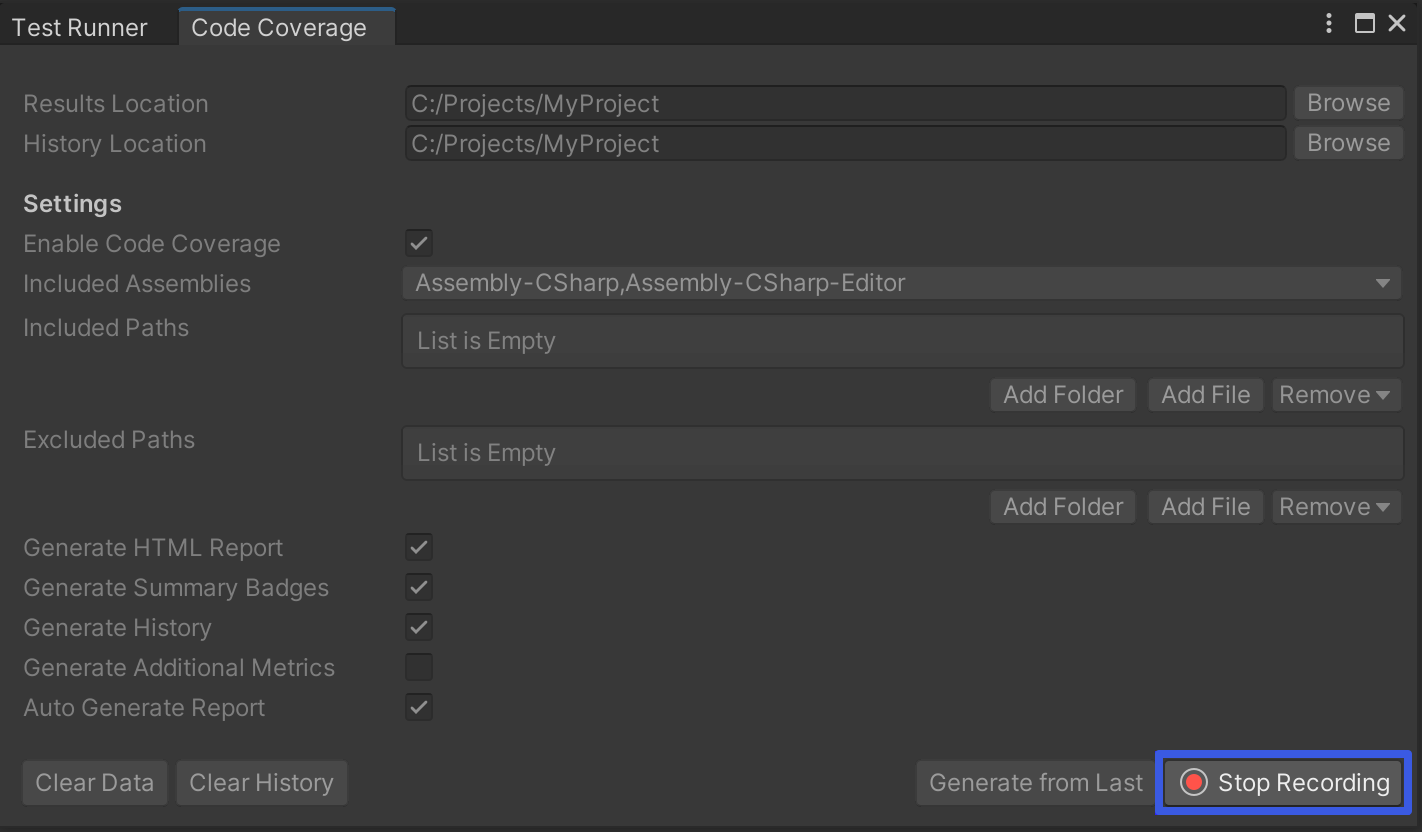
7. A file viewer window will open up containing the coverage report. **Note** that to generate the report automatically after you stop recording you should have **Auto Generate Report** checked in the [Code Coverage window](CodeCoverageWindow.md). Alternatively, you can select the **Generate from Last** button.
8. Select `index.htm`.
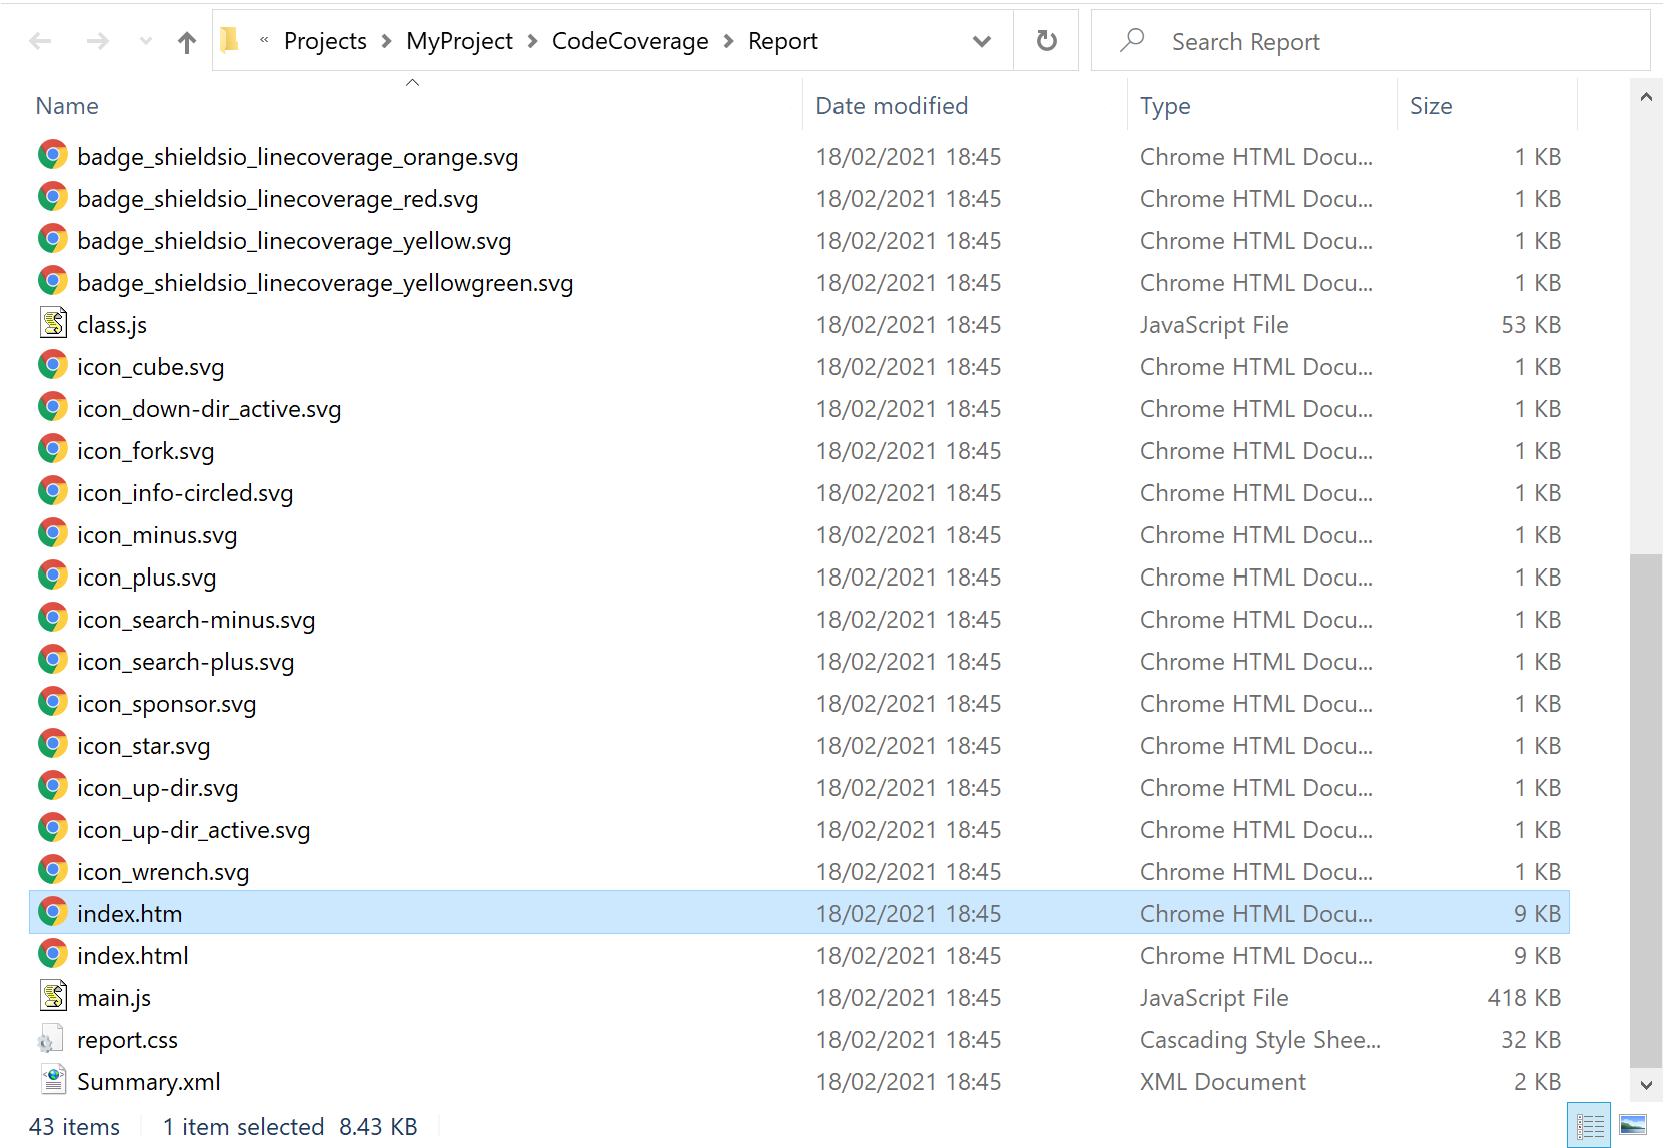
9. This opens the [HTML coverage report](HowToInterpretResults.md).
