# Rendering Debugger
The **Rendering Debugger** is a window you can customize with your own controls and scripts to visualize your project's lighting, rendering, or Material properties.
If your project uses a custom Scriptable Render Pipeline (SRP), you can add controls to the default empty window.
If your project uses the Universal Render Pipeline (URP) or the High-Definition Render Pipeline (HDRP), refer to the following pages:
- [Add controls to the Rendering Debugger in URP](https://docs.unity3d.com/Packages/com.unity.render-pipelines.universal@15.0/manual/features/rendering-debugger-add-controls.html)
- [Add controls to the Rendering Debugger in HDRP](https://docs.unity3d.com/Packages/com.unity.render-pipelines.high-definition@15.0/manual/Rendering-Debugger-Add-Controls.html)
## How to access the Rendering Debugger
The Rendering Debugger window is available in the following modes:
| Mode | Platform | Availability | How to Open the Rendering Debugger |
|------------|----------------|--------------------------------|-------------------------------------------------------------------------------------------------------------------------------------------------------------------------------------------------------------------------------|
| Editor | All | Yes (window in the Editor) | Select **Window > Analysis > Rendering Debugger** |
| Play mode | All | Yes (overlay in the Game view) | On a desktop or laptop computer, press **LeftCtrl+Backspace** (**LeftCtrl+Delete** on macOS)<br>On a console controller, press L3 and R3 (Left Stick and Right Stick) |
| Runtime | Desktop/Laptop | Yes (only in Development builds) | Press **LeftCtrl+Backspace** (**LeftCtrl+Delete** on macOS) |
| Runtime | Console | Yes (only in Development builds) | Press L3 and R3 (Left Stick and Right Stick) |
| Runtime | Mobile | Yes (only in Development builds) | Use a three-finger double tap |
To disable the runtime UI, use the [enableRuntimeUI](https://docs.unity3d.com/Packages/com.unity.render-pipelines.core@17.0/api/UnityEngine.Rendering.DebugManager.html#UnityEngine_Rendering_DebugManager_enableRuntimeUI) property.
## Navigation at runtime
### Keyboard
| Action | Control |
|----------------------------------------------------|-------------------------------------------------------------------------------------------|
| **Change the current active item** | Use the arrow keys |
| **Change the current tab** | Use the Page up and Page down keys (Fn + Up and Fn + Down keys respectively for MacOS) |
| **Display the current active item independently of the debug window** | Press the right Shift key |
### Xbox Controller
| Action | Control |
|----------------------------------------------------|-------------------------------------------------------------------------------------------|
| **Change the current active item** | Use the Directional pad (D-Pad) |
| **Change the current tab** | Use the Left Bumper and Right Bumper |
| **Display the current active item independently of the debug window** | Press the X button |
### PlayStation Controller
| Action | Control |
|----------------------------------------------------|-------------------------------------------------------------------------------------------|
| **Change the current active item** | Use the Directional buttons |
| **Change the current tab** | Use the L1 button and R1 button |
| **Display the current active item independently of the debug window** | Press the Square button |
## Add a control
The **Rendering Debugger** window can contain multiple tabs ('panels'). When you select a panel, the window displays one or more controls ('widgets').
To create a widget and add it to a new panel, do the following:
1. Create a script that uses `using UnityEngine.Rendering;` to include the `UnityEngine.Rendering` namespace.
2. Create a widget by creating an instance of a child class of [DebugUI.Widget](../api/UnityEngine.Rendering.DebugUI.Widget.html), for example `DebugUI.Button`.
3. In the widget, implement the `onValueChanged` callback, which Unity calls when you change the value in the widget.
4. Create a panel using [DebugUI.instance.GetPanel](../api/UnityEngine.Rendering.DebugManager.html#UnityEngine_Rendering_DebugManager_GetPanel_System_String_System_Boolean_System_Int32_System_Boolean_).
5. Add the widget to an array.
6. Add the widget array to the list of children in the panel.
If you add 2 or more widgets to the array, the panel displays the widgets in the same order as the array.
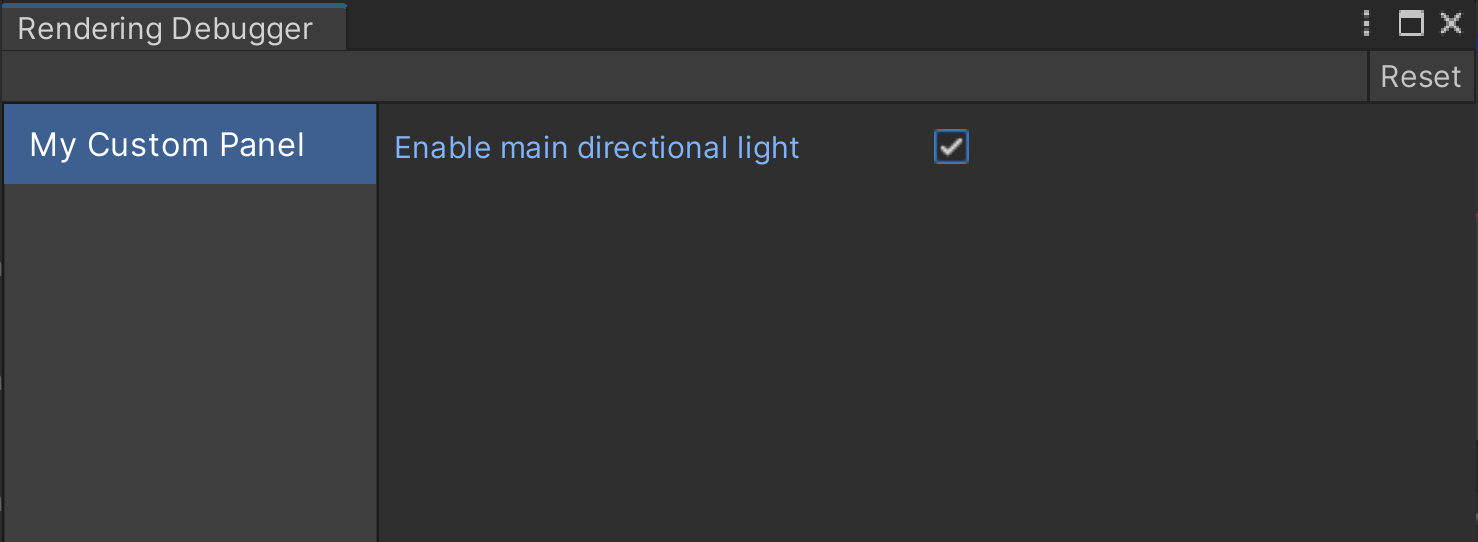
The following code sample creates and adds a widget that enables or disables the main directional light:
```
using UnityEngine;
using UnityEngine.Rendering;
using System.Collections.Generic;
using System.Linq;
[ExecuteInEditMode]
public class CustomDebugPanel : MonoBehaviour
{
static bool lightEnabled = true;
void OnEnable()
{
// Create a list of widgets
var widgetList = new List<DebugUI.Widget>();
// Add a checkbox widget to the list of widgets
widgetList.AddRange(new DebugUI.Widget[]
{
new DebugUI.BoolField
{
displayName = "Enable main directional light",
tooltip = "Enable or disable the main directional light",
getter = () => lightEnabled,
// When the widget value is changed, change the value of lightEnabled
setter = value => lightEnabled = value,
// Run a custom function to enable or disable the main directional light based on the widget value
onValueChanged = DisplaySunChanged
},
});
// Create a new panel (tab) in the Rendering Debugger
var panel = DebugManager.instance.GetPanel("My Custom Panel", createIfNull: true);
// Add the widgets to the panel
panel.children.Add(widgetList.ToArray());
}
// Remove the custom panel if the GameObject is disabled
void OnDisable()
{
DebugManager.instance.RemovePanel("My Custom Panel");
}
// Enable or disable the main directional light based on the widget value
void DisplaySunChanged(DebugUI.Field<bool> field, bool displaySun)
{
Light sun = FindObjectsOfType<Light>().Where(x => x.type == LightType.Directional).FirstOrDefault();
if (sun)
sun.enabled = displaySun;
}
}
```
Add the script to a GameObject. You should see a new **My Custom Panel** panel in the **Rendering Debugger** window.
### Add a control to an existing panel
You can only add properties to existing panels if you're using a custom SRP. You shouldn't add widgets to URP or HDRP's built-in Rendering Debugger panels.
To fetch an existing panel, use `DebugManager.instance.GetPanel` with the panel name. Set `createIfNull` to `false`, so you don't accidentally create a new panel if the name doesn't match an existing panel.
The following code sample fetches the panel from the code sample above:
```
var panel = DebugManager.instance.GetPanel("My Custom Panel", createIfNull: false);
```
## Add a container
You can use containers to display groups of widgets together.
1. Create a container using one of the child classes of [DebugUI.Container](../api/UnityEngine.Rendering.DebugUI.Container.html), for example `DebugUI.Foldout`.
2. Add a widget array using the container's `Add` method.
The following example creates a collapsible container that contains 2 checkboxes:
```
using UnityEngine;
using UnityEngine.Rendering;
using System.Collections.Generic;
[ExecuteInEditMode]
public class CustomDebugPanelWithContainer : MonoBehaviour
{
void OnEnable()
{
// Create a list of widgets
var widgetList = new List<DebugUI.Widget>();
// Add 2 checkbox widgets to the list of widgets
widgetList.AddRange(new DebugUI.Widget[]
{
new DebugUI.BoolField
{
displayName = "Visualisation 1",
},
new DebugUI.BoolField
{
displayName = "Visualisation 2",
},
});
// Create a container
var container = new DebugUI.Foldout
{
displayName = "My Container"
};
// Add the widgets to the container
container.children.Add(widgetList.ToArray());
// Create a new panel (tab) in the Rendering Debugger
var panel = DebugManager.instance.GetPanel("My Custom Panel With Container", createIfNull: true);
// Add the container to the panel
panel.children.Add(container);
}
}
```
## Control the Rendering Debugger overlay
To change the value of the currently active widget:
- On a keyboard, press the Left and Right arrow keys.
- On a touch screen, tap the arrows next to the properties.
- On an Xbox controller, use the Directional pad (D-Pad).
- On a PlayStation controller, use the Directional buttons.
To change the current panel:
- On a Windows keyboard, use the Page up and Page down keys (macOS: fn + Up arrow key, and fn + Down arrow key).
- On a touch screen, tap the arrows next to the tab title.
- On an Xbox controller, use the Left Bumper and Right Bumper.
- On a PlayStation controller, use L1 and R1.
To display the currently active widget independently of the debug window:
- On a keyboard, press Right Shift.
- On an Xbox controller, press X.
- On a PlayStation controller, press Square.
## Disable the Rendering Debugger
To disable the Rendering Debugger in your built application, set [DebugManager.enableRuntimeUI](https://docs.unity3d.com/Packages/com.unity.render-pipelines.core@15.0/api/UnityEngine.Rendering.DebugManager.html#UnityEngine_Rendering_DebugManager_enableRuntimeUI) to `false`.